
It is said that big data is a kilometre wide but only a millimetre thick. It is providing us with a lot of numbers but the information can lack depth. There are many factors involved in why people choose to travel, the method they use to do it and the path they take. We need a comprehensive range of data to ensure we understand fully the environment in which we work.
We need to consider the type of data collection, sometimes by traditional methods, to get information about such things as the demographics of travellers, the purpose for making the journey and the way trips are affected by factors not related to the individual themselves but related to those of others in the household. NSW conducted its first Household survey in 1971 which was done in the traditional style of focussing mainly on car trips. It also allowed proxy reporting which mean that there were way too few trips recorded in the off peak. The first more comprehensive survey, that obtained international credit, was done in 1981 (https://trid.trb.org/view.aspx?id=187405). It was conducted through the Ministry of Transport’s State Transport Study Group and the project leader was Liz Ampt. This was a snap-shot of travel information for a "day in the life" of people, a little like the census is a snap-shot of economic and social factors at one particular point in time.
The survey has now evolved into a rolling assessment taking small samples on every day of the year. It is described as the largest and most comprehensive source of personal travel data for the Sydney Greater Metropolitan Area. Because of the sample size it is hard to dig down into disaggregated information but it can give invaluable insights and highlight areas where further survey work could be done. Much Big Data is a complement to this work rather than an end in itself. These types of surveys are hard work for the organisers and those members of the public who have to answer a wide range of questions. Modern digital technology is being utilised to make it easier by moving away from handwriting all your activities to being able to record data on iPads for example.
One point that is often overlooked and will certainly not be captured by counting vehicle or people movements is that this type of survey can also bring to our attention how many people are not travelling and the reasons for this. An excellent example of the value of a detailed Household Travel Survey is the recently completed HTS conducted in Fiji. It was carried out in 2015 and was the first of its kind in an island nation of the tropical Pacific. The survey had input from several companies in Australia and Fiji as well as the Fijian government. The project was led by John Richardson's Predict Consulting from Melbourne and also on the team was Liz Ampt from Concept of Change. Liz established Sydney’s first household travel survey and is now a world expert in this area.
Fiji has been enjoying a period of prosperity and the government wanted to make use of available funds to build some infrastructure projects that would benefit the nation. But they had no data on which to evaluate various projects. Every situation has its own difficulties. Fiji’s population of approximately 845,000 is dispersed across 106 islands, roughly split equally between people living in urban and rural areas. The monsoon season has a huge effect on travel and the ability to collect data.
The survey team presented this picture of a typical rural village in Fiji.
Figure 1:
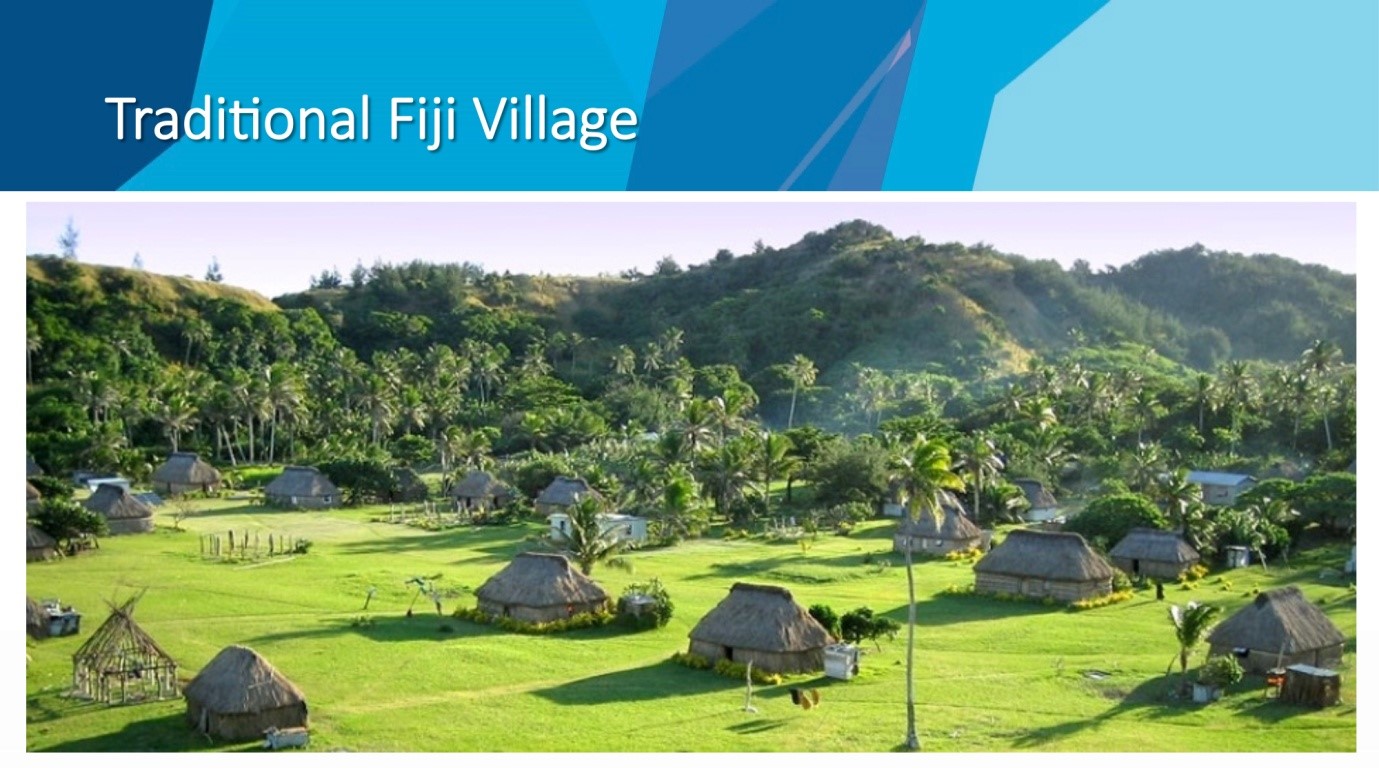
Figure 1: A Typical rural Fijian Village
The survey was very successful. An 89% acceptance rate was recorded and in the maritime areas, it was an unheard of 99%. This shows the value of public acceptance of government activities carried out for the benefit of the community and perhaps it also shows the warm and friendly nature of the Fijians. One of the most revealing facts that came out of the survey was that many Fijians did not travel. Some 52% of people and 19% of households recorded no trips at all on their travel day. At one presentation the survey team were asked why you need to have a travel survey when such a large number of people do not travel?
But the point is that to know that people don’t travel is as important as counting the trips others make. When autonomous cars become readily available in some countries, for example, how many extra trips will be made by people who currently cannot travel because they cannot drive a car because they are young, old or disabled? Only a detailed understanding of people’s situations will help you estimate the number.
Here is just one of the graphs that the Fiji survey produced which really only begins to scratch the surface of the nature and depth of information that can be procured.
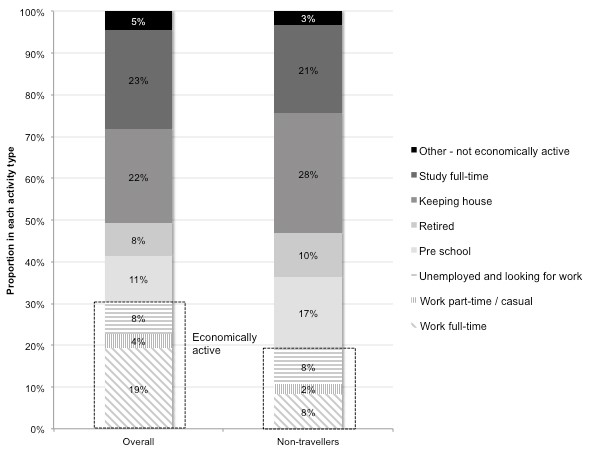
Figure 2: Activity type breakdown
Furthermore these surveys can find unexpected factors. The usual modes of travel in most countries are walking, cars, trains, trams, trains and bicycles. In Fiji they discovered the need for an additional mode for the journey-to-work: swimming. Apparently some people worked on the other side of the river and the quickest way there is to swim across. A consequence we might consider from this unexpected mode of travel is that collecting big data usually relies on electronic devices such as mobile phones to measure trips. Swimming obviously makes this difficult.
It is expected that the survey will be repeated for the next two years. The survey team reported that to date these types of surveys have been mostly conducted in developed countries such as New Zealand (ongoing), United Kingdom (first conducted in 1965), the Netherlands (annually since 1995) and the USA (2016). The Fiji Household Travel Survey, while conducted in a culture with some significant differences to what we might be used to, clearly shows the value of in-depth surveys that broaden our understanding of the needs we aim to meet.
Important links
Predict Consulting http://www.predictconsulting.com/
Concepts of Change http://conceptsofchange.com.au/